We are pleased to note that yesterday we reached the 50 million download mark for Apache OpenOffice 3.4. This milestone occurred within a few days of the first anniversary of the release of Apache OpenOffice 3.4., on May 8th, 2012.
Apache OpenOffice (formerly called OpenOffice.org) is the leading free and open source office application suite for Windows, Mac and Linux. Version 1.0 of OpenOffice was released 11 years ago, in May 2002.
Although we're all very busy now with the testing of our next major release, Apache OpenOffice 4.0, it is worth taking a few minutes to explore some of the trends that can be discerned from our download data over the past year. The information we have gathered, relative to desktop OS versions, 64-bit Linux use, screen aspect ratios, etc., may be of special interest to other open source projects to consider in their
planning.
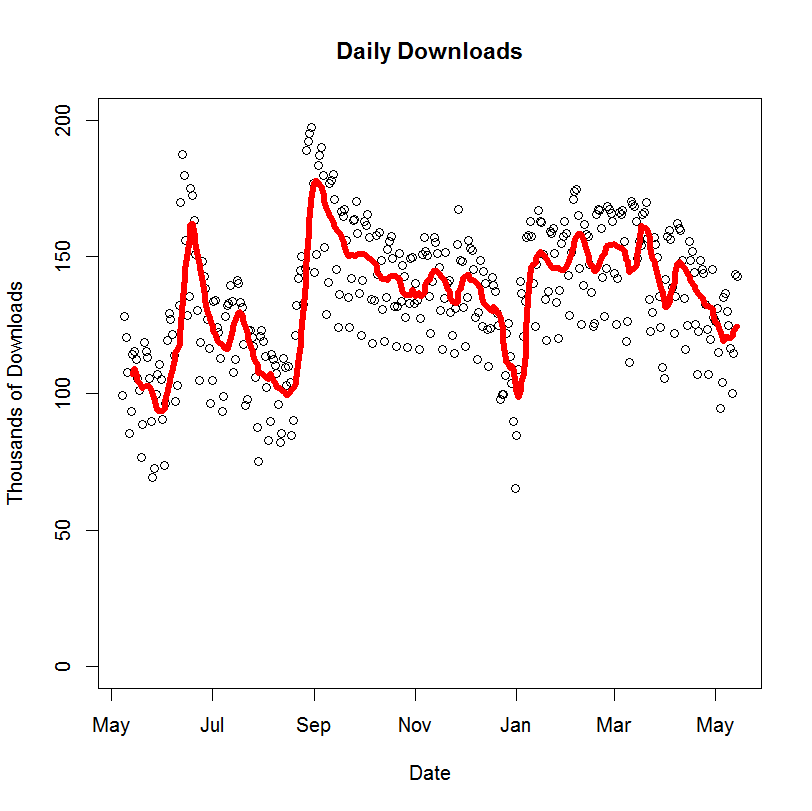
First a scatter plot of daily download numbers, with a 7-day moving average overlay. Noticeable on the chart is the peak in June 2012, when we enabled the upgrade notifications for OpenOffice.org 3.3.0 users, and the peak in September when Apache OpenOffice 3.4.1 was released. There is also a noticeable summer lull and big drop around the end-of-year holidays.
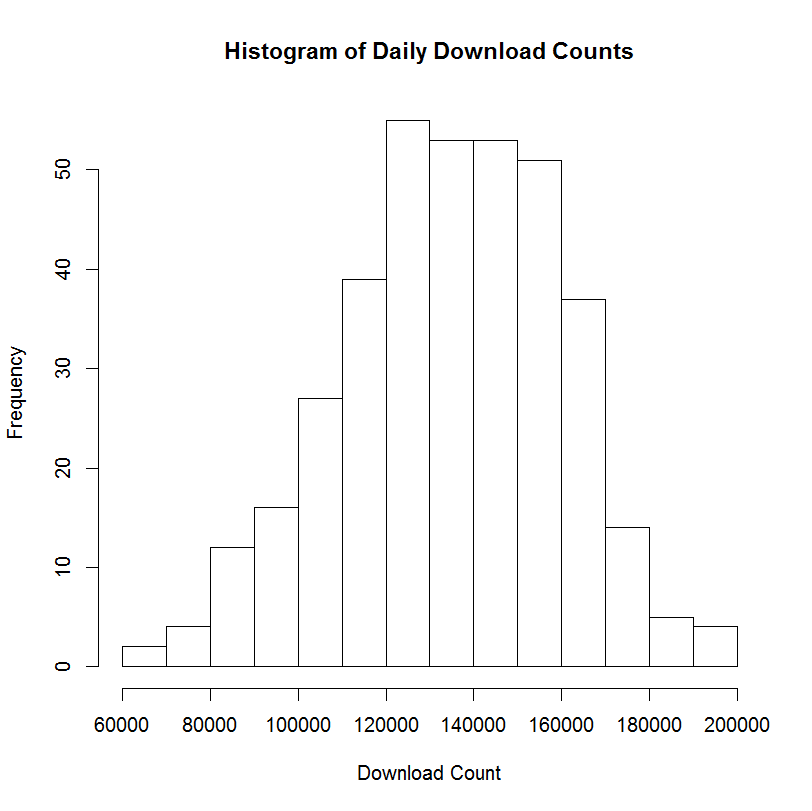
The following histogram shows the distribution of download counts. The average daily download count is 134,900, with a peak day of 197,500. On average we see around a million downloads every 7.4 days. Since a typical download size is
130MB, this amounts to an average of around 17 TB per day of downloads,
ably handled by SourceForge and their distribution network.
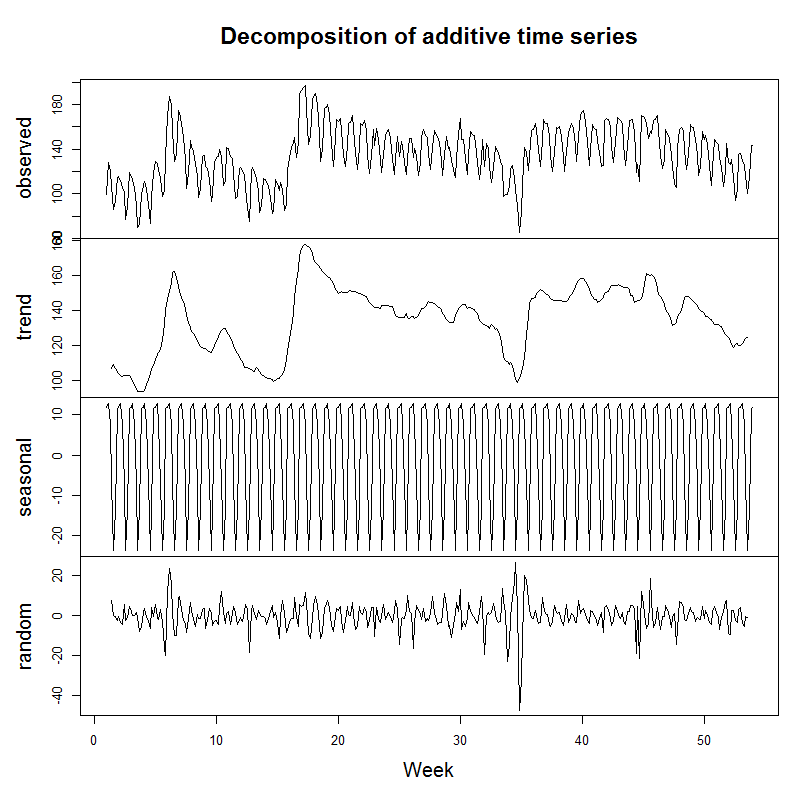
One final way to look at the daily counts (shown here in unit of 1000 downloads) is to decompose it into the sum of a smooth trend, a periodic weekly trend, and residual random noise:
We are able to break down these trends along several other dimensions. One is by country, looking at where the download request came from. This information is gleaned from the IP address of the machine making the request. Since each IP address is part of an assigned block of addresses, and blocks are assigned geographically, we can create a table of downloads by country, territory, etc. We show the full table our the website, of all 237 countries, territories, etc., but here are the top 10:
| #1 | United States | 9,782,293 |
| #2 | France | 6,738,682 |
| #3 | Germany | 4,947,255 |
| #4 | Italy | 4,484,601 |
| #5 | Japan | 2,742,292 |
| #6 | United Kingdom | 2,214,791 |
| #7 | Spain | 1,925,193 |
| #8 | Russia | 1,830,316 |
| #9 | Canada | 1,527,682 |
| #10 | Netherlands | 833,691 |
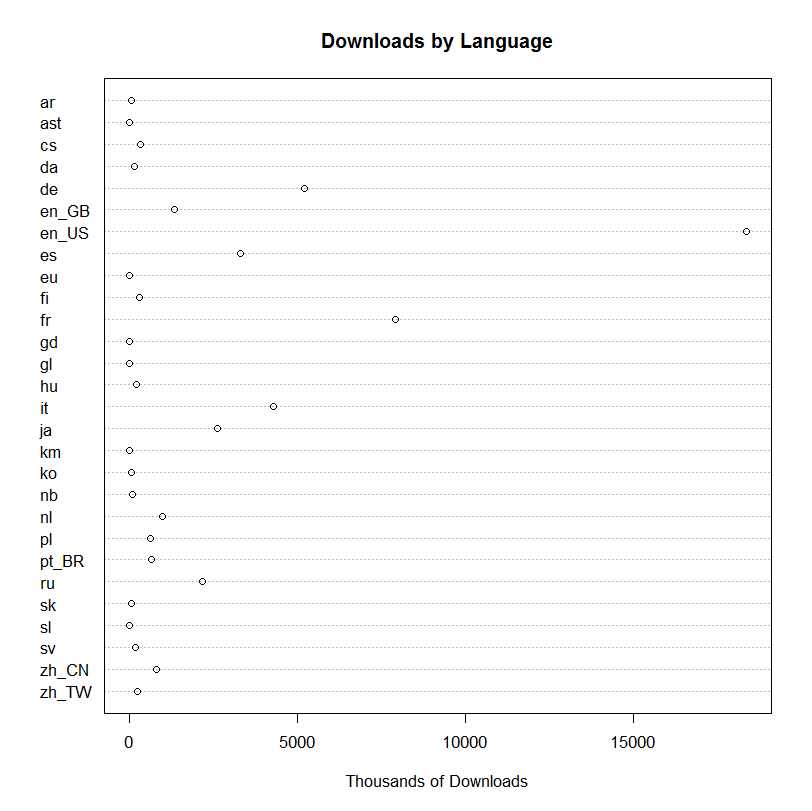
Another approach is to look at which localized versions of Apache OpenOffice were downloaded. We can see these trends in the following dot chart:
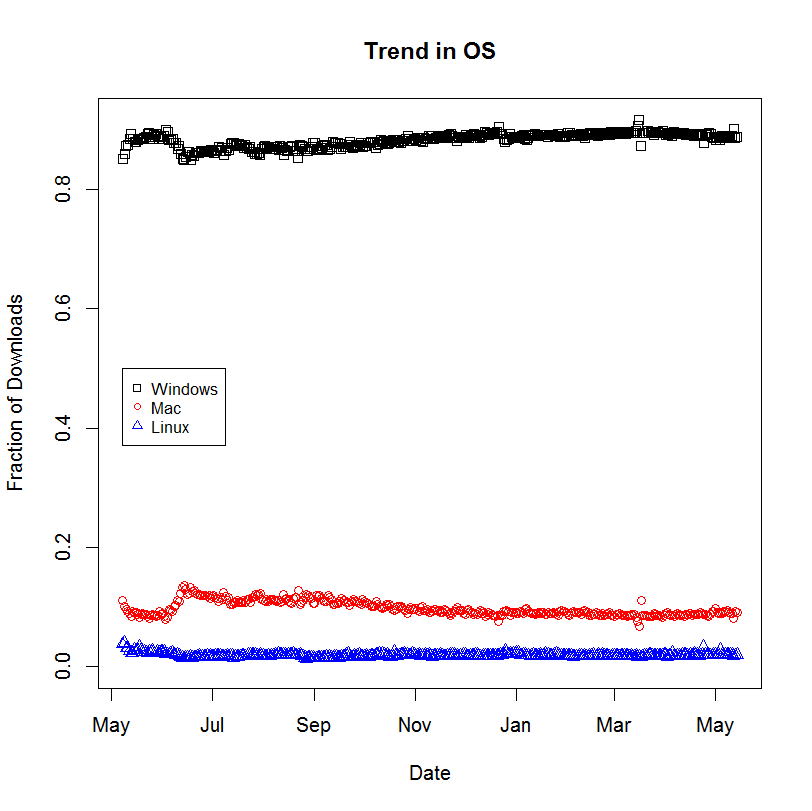
We can also look at the trend over time of downloads by operating system. OpenOffice is a mainstream open source desktop application, so the OS distribution reflects overall desktop operating system market shares, and with a slight growth in Windows at the expense of Mac:
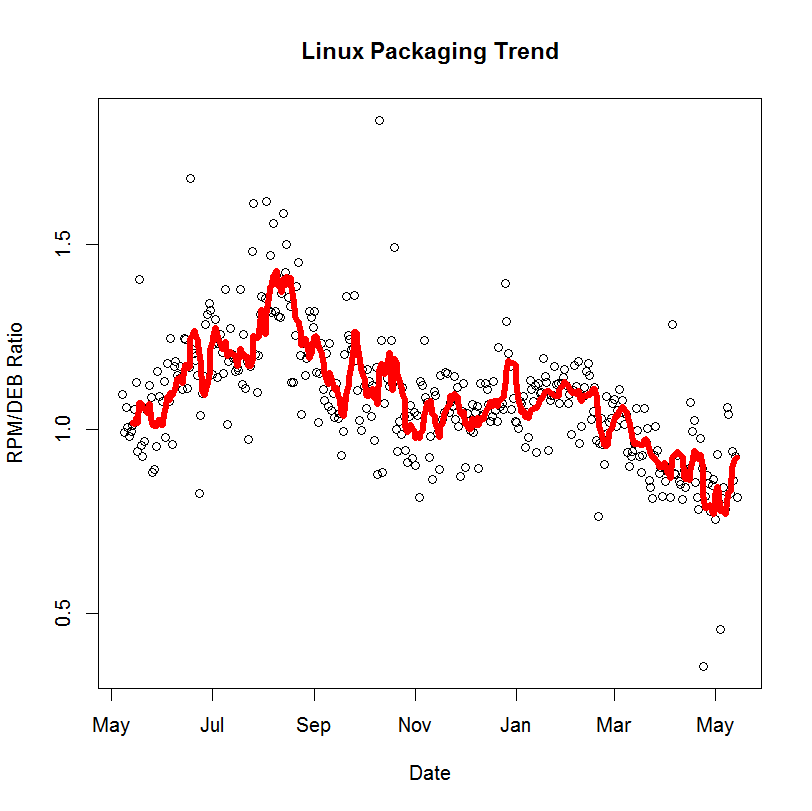
Since we have Linux versions of OpenOffice packed as RPMs (e.g., for RedHat) as well as DEBs (e.g., for Ubuntu), we can look for trends in the ratio of requests for these two packaging formats over time:
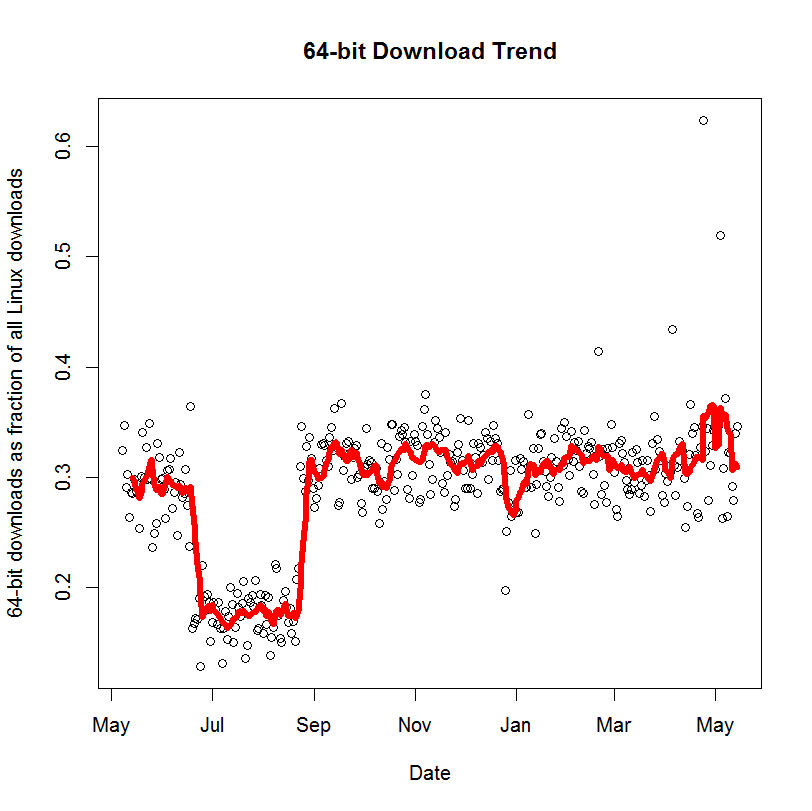
Also, we have 32-bit and 64-bit Linux downloads, and we see a gradual increase in demand over time for the 64-bit version, though the 32-bit version still dominates. (The drop in July-September is not fully explained, but may have been an error in our download page that was not recommending 64-bit downloads appropriately.)
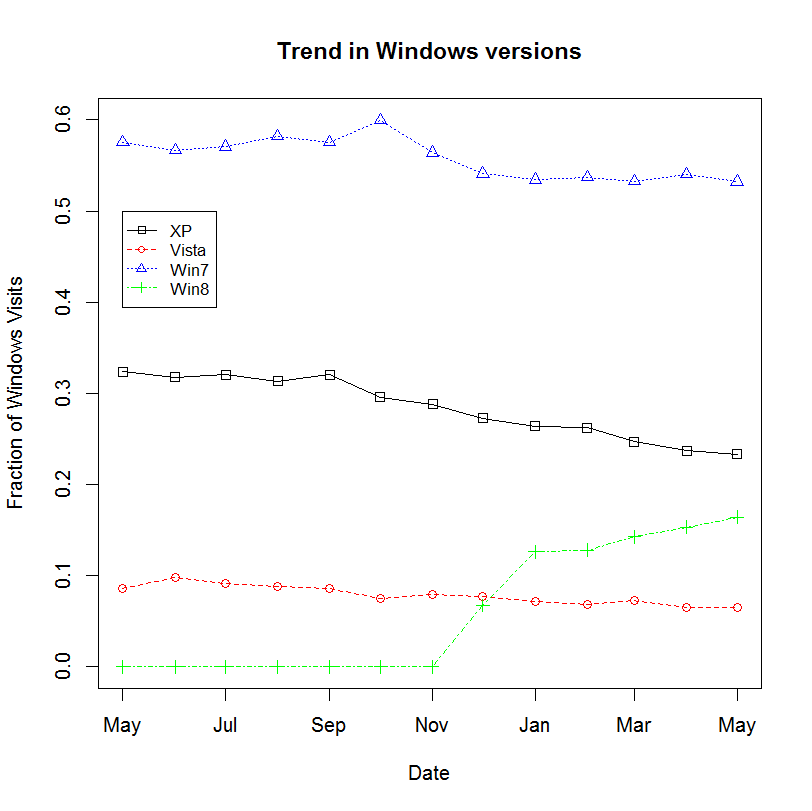
Although we don't have detailed download data for different Windows versions (we have a single download for all Windows users) we do have information from website visitors (nearly 7 million visitors per month) that tells a similar story. Windows 7 remains the most popular Windows version for our users, accounting for over half of Windows visitors. Windows XP is in second place, though declining. At the end of the year Windows 8 overtook Vista for 3rd place, and continues to rise.
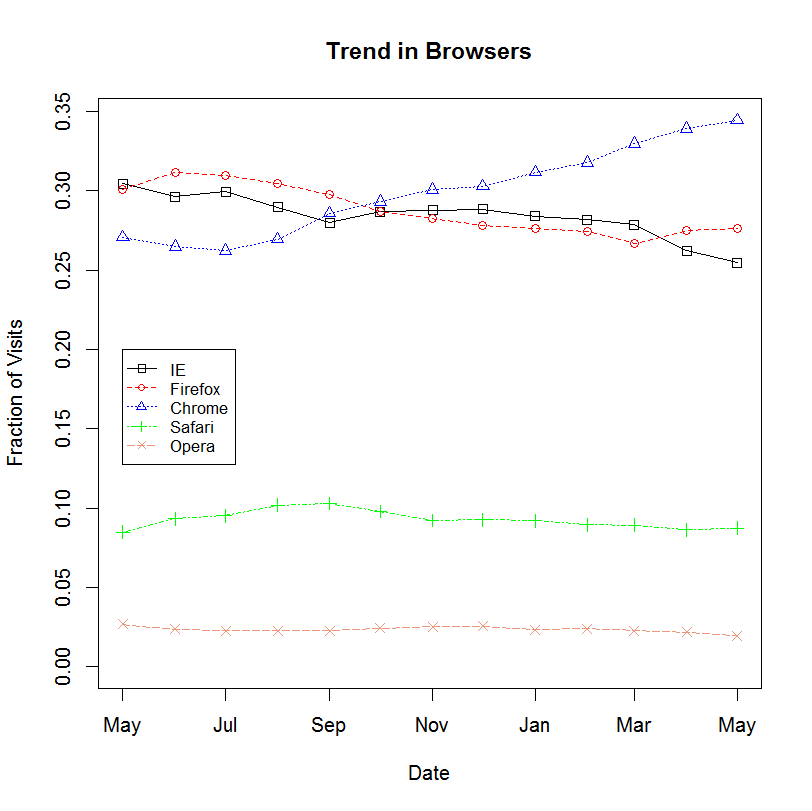
Looking at the similar data for web browsers, we see the rise in Chrome users among our website visitors:
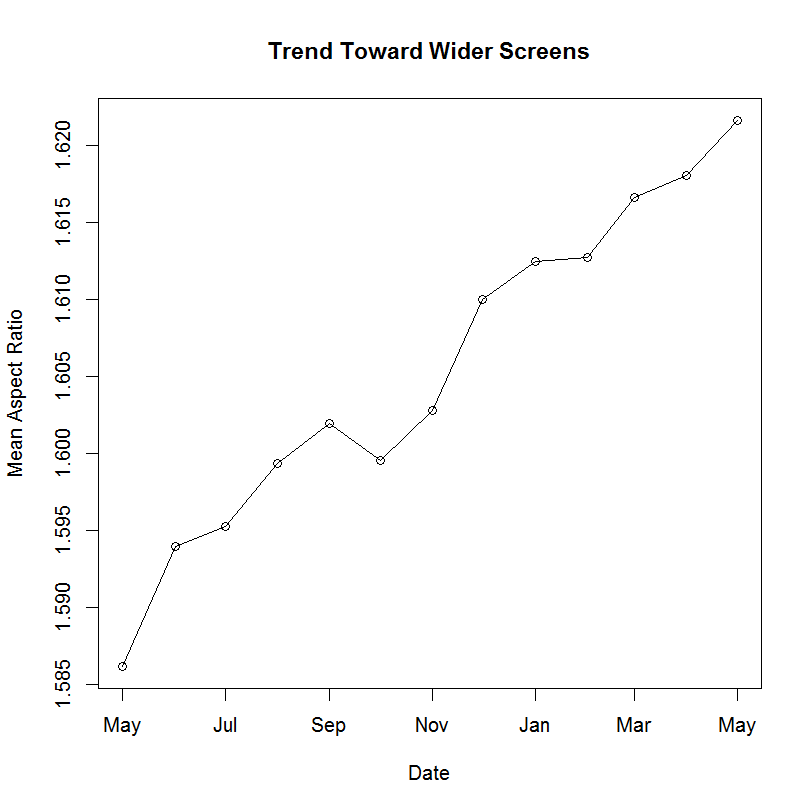
Information from website visitors also tells us their screen resolution. There is a huge diversity of screen resolutions, but the general trend is a gradual increase in HD 16:9 resolutions and away from the older 1280x800 and 1024x768 modes. If you average it all out and look at the average aspect ratio, you see a slow, but steady trend toward increased aspect ratios (wider screen monitors):
The above charts were made in R, using data from SourceForge's REST API and from Google Analytics. The processing of the SourceForge data was automated via a custom Python script.