I just wanted to send some notes about added features which are part of AOO3.4 version. This one is actually the result of fixing tasks #118558#, #118485#, #108221# and #67705# which are all about GraphicObjects, OLEObjects (OLE means Object Linking and Embedding) and their geometrical attributes and properties. You may take a look at the tasks if you are interested in details, here I want to describe the benefits.
GraphicObjects are used when you insert a picture (pixel and vector data) or convert something to it. They already supported the full attribute set, so line style, fill style, text and shadow are possible. Geometrically, they could be transformed widely, but could not be sheared. Because now the content of GraphicObjects is displayed using primitives (and these are fully transformable) it is possible to also use shear and thus now completely support all geometrical transformations used in the office.
More interesting is that this is also true for OLEObjects, thus I added all these possibilities to OLEObjects of any kind, not only to our own internal OLEObjects (e.g. Chart, mathematical formula), but all possible external OLEObjects. These can now have line styles, fill styles, text and shadow and can be fully transformed. It is also possible to convert them to GraphicObjects which is the base for converting them to something else. Thus, you may now slant or distort OLEObjects, convert them to GraphicObjects, make geometrical modifications like merge/subtract/intersect with other objects or even convert them to 3D objects.
Some of the possible changes may lead too far for daily use, but some are pretty useful. It is now e.g. possible to add a mathematical formula and position it somewhere vertically by rotating it 90 degrees. It is possible to rotate chart OLEObjects themselves to get chart displays which the chart itself does not directly support. It is also useful to add a frame to a chart. With using the text offset it is also possible e.g. to add text to the OLEObject and move the text outside the object to get a caption. I leave more possibilities to your imagination...Some examples:
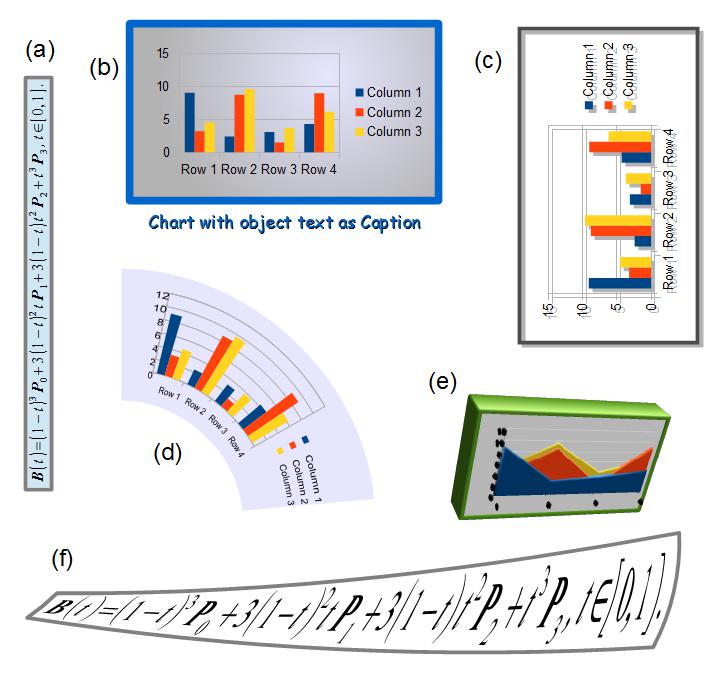
(a) Math OLEObject rotated 90 degrees, blue filled and with border
(b) Chart OLEObject with gradient fill, border and object text as caption
(c) Same chart without fill, 90 degree rotation and shadow
(d) Chart bend in 2D, converted to GraphicObject (no longer an OLEObject)
(e) Chart OLEObject converted to 3D (only for demonstration, not too nice to view...)
(f) The math OLEObject, converted and bent, fill removed
I hope you got an impression; I'm not the designer guy, so excuse the examples.
Regards,
Armin